[HOME]
A Collage Education
(making collages in Python)
In March 2019, I developed an interest in generating some images using existing paintings. After a few false starts, I finally picked the project back up in December 2019.
the approach
some details
the goods
After a bit of noodling, I downgraded my ambition
Here were some of the false starts I had on this project:
Neural Networks
I was going to use this as a chance to explore neural networks. Given that my laptop does not have an NVIDIA GPU (no CUDA) and that I haven't tinkered with even simple neural network architectures, this seemed like a bad first step. It sounds like Google Colab might be a nice place to experiment with these things without needing a different laptopa.k.a. a change of 'chinery or going down the AMD rabbithole.
Simple Linear Regression
When I started, there was a lot of noise about this paper (or I think there was...the paper seems to be from mid 2018 so maybe I was looking at crystallized noise from yesteryear). That made me think: how about a simple regression? Maybe one model per color per pixel, or one model per color per patch, or one model per color per image. Compressing a patch or an image to single value was not something I explored, and doing something "per pixel" with a 300x300 image is...silly. It took forever to run and produced ugly noise, so I stopped exploring this path. That is not to say it is impossible, just that it was not worth the effort for me or my little laptop.
from image generation to image recombination. The pixel was no longer a sufficient building block for creating an image: any naive approach to sampling and pasting pixels is going to wind up looking like noise. When I thought about the way people remix images, collage
This is less fun than a magic painting generator, but just as collages are among the first art projects for many, so too is this my first go.
was the first medium that came to mind.
It started making sense to take a group of pixels as a building block. It feels natural to think of an image as composed of some figures, be they men or cats or houses or some abstract chunks of color. The problem here is defining and identifying figures in the paintings. In fact, just call a figure a "blob" and this turns out to be a well known class of problems called blob detection. I found this out late in my journey, and I imagine a lot of blob detection methods are more clever than the method I chose. I landed on k-means,
- Pick a number of clusters N.
- Initialize N points.
- Assign pixels to the point they are
closest
In this case, we are talking about the Euclidean distance between a pixel and a
mean-pixel, grr
but there are a lot of other ways we could calculate our distance, like the Manhattan distance (the absolute value of the difference between the two points). Any one of these could be given a shot.
grr
but there are a lot of other ways we could calculate our distance, like the Manhattan distance (the absolute value of the difference between the two points). Any one of these could be given a shot.
to. If this is not the first iteration, and no points changed clusters, call it quits.
- For each cluster, average the assigned points to generate a new mean. Return to step 3.
because it seemed natural for me to think of blobs as being made up of pixels of a
similar color.
A pixel can be thought of as a point in 3D space,
Specifically, it's a point in a cube. RGB colorspace is not a vector space. My (limited) understanding from reading that is that a vector space has to be defined over a field, and color values do not form a field because they don't obey some key field axioms. Since every element of the set of 8-bit colors has to be a natural number n such that 0 ≤ n ≤ 255, there can be no additive or multiplicative inverses that are also elements of the set (i.e. 8-bit colors are not closed under taking either of these inverses).
where its red, green, and blue values are coordinates. Why is it neat that a pixel is a point? Well, we can do some neat things with points, like compute the Euclidean distance or the Manhattan distance between them, or average them to create a new point, or take find their geometric median. And if we can do these things, we can apply certain clustering algorithms to our pixels.
This idea is not unheard of.
There are two big issues I see with this naive approach to grabbing blobs. The first issue is that color similarity is not always the defining feature of what we might intuitively call a figure. The second issue is that there is no notion of connectedness to our blobs. Let's watch the script in action:
Do you see what's happening?
Take a look at the final painting.
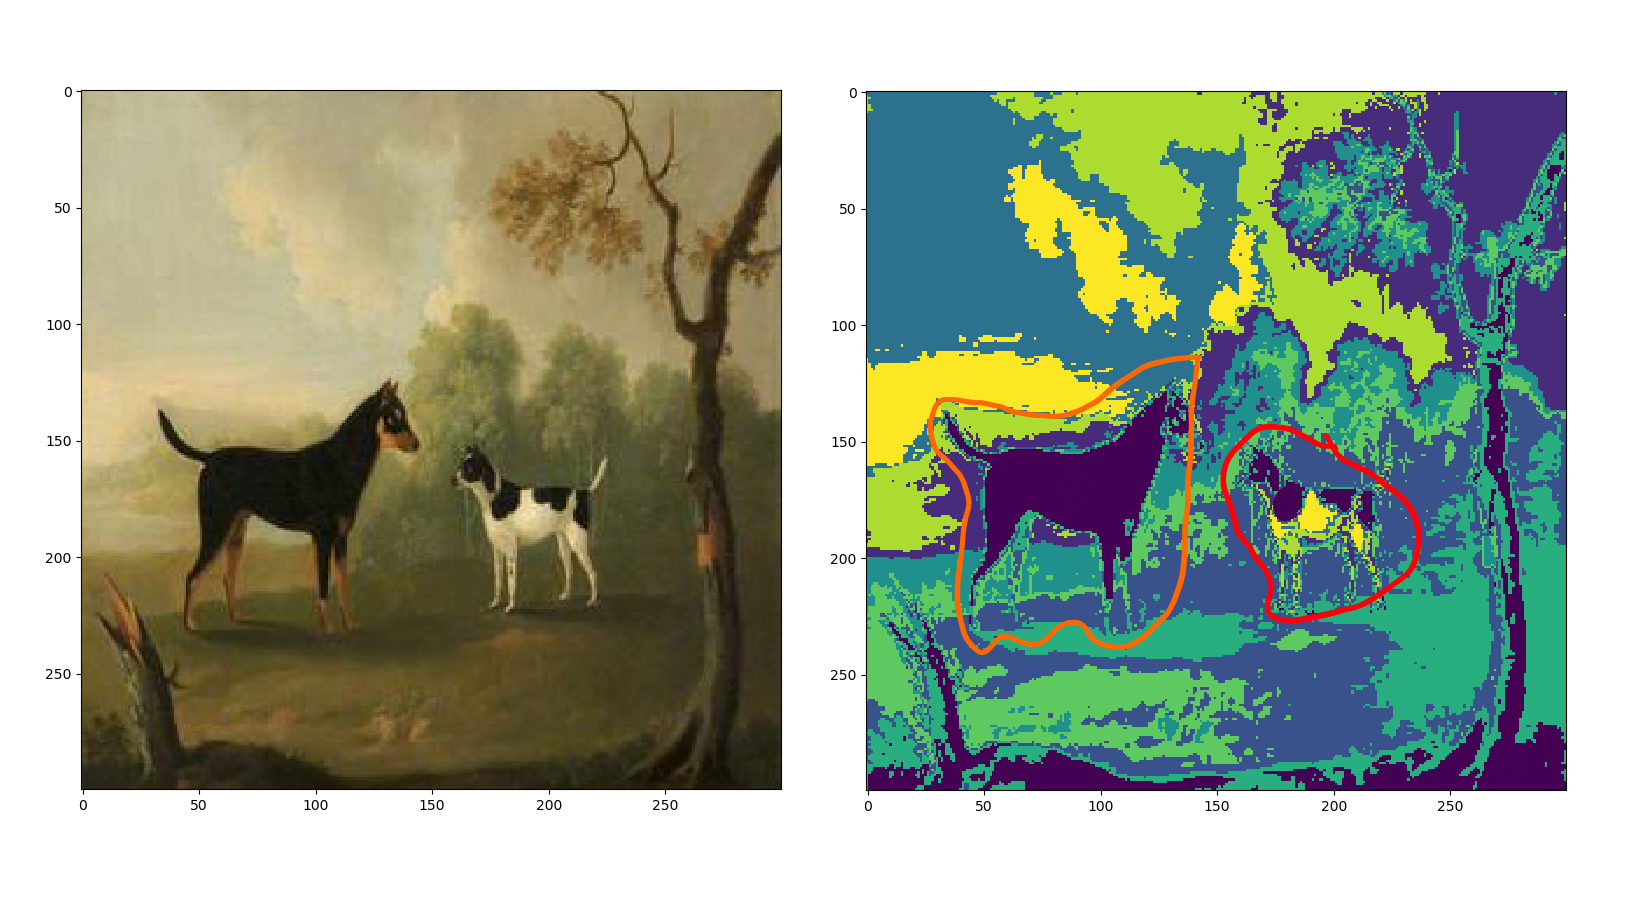 On the left, we see two lovely doggies. On the right, we see six ugly blobbies. In orange, I circled an example of an intuitive figure: a whole dog. In red, I circled the unintuitive figure: a butchered dog. That highlights issue number one: we don't want to butcher dogs. Notice that our dog-blob is deep purple. We can see that same dog-blob contains parts of a tree and some choicer cuts of our butchered dog. That highlights issue number two: we can't take care of a dog and a tree.
Issue number one seems tough to tackle. As long as I cluster solely on color, I will always wind up butchering figures with a lot of color variance (like a black and white dog). I have very rough thoughts
Here's a sketch of where my thoughts are:
- Once we cluster, we can go and label every connected component in the image.
- From there, we should be able to define and locate edges for those connected components.
- If we walk from the edge of a given connected component to the boundary of the image itself, what other connected components do we cross?
- For every connected component, we have an ordered collection of crossings for each direction.
- That information should let us define something like containment, where e.g. a dog might contain its spots, and both might be contained by a background. This containment might need the ability to be "weak" or "strong" or something like that, but I think it is something that can be done.
I'll need to do some reading.
that I might like to polish, but I'm also gathering some reading material
This whole thesis.
This paper from before that thesis.
Another thesis, focused on hands.
Chapter 17 of Computer Vision: A Modern Approach
on this in case I revisit the project. Feel free to share any ideas.
Issue number two seems easier to address. We need to introduce connectivity. Since we pick only one color-blob per iteration we essentially have a binary image, which means there are some straightforward methods available to us. We use the linked algorithm, which I think amounts to a depth-first search (unless of course I implemented incorrectly).
This doesn't count as incorrect, but I didn't use recursion which is strange considering I've been abusing recursion at work recently.
We then take the largest connected component of the randomly selected cluster and paste that into the new image.
Let's watch the script in action now that we've introduced connectivity:
Not bad!
Of course, it's not great either. Dogs are still being butchered. You might also have noticed that the component from the second image wraps around.in the future we will paint on tori. Unfortunately I made the video before I noticed the problem, but I did wind up putting bounds on pixel neighbors to prevent this.
The final approach is as follows:
- Take a string of words
I'm using a random sample from a big list of English words, but there's no reason I couldn't just sample from the image titles themselves or
take user input.
I had configured the script as a Flask app that ran on a Raspberry Pi hooked up to a monitor. The Pi served up an HTML form where I could submit words to generate an image and display it to the screen. This was educational but also overkill.
as input (this could be a user entered value or a randomly selected word).
- Flip through a directory of images and nab any painting whose title contains a search word.
- Sample a random image.
- Cluster the pixels in the image using k-means.
- Choose a random cluster.
- Label the connected components in the chosen cluster.
- Take the largest connected component.
- Place each pixel from this connected component in the same position in the new image (so long as that position is currently empty).
- Iterate until every pixel in the new image is non-black or 200 iterations
Why 200, you ask? Well, I wish I had a reason. I didn't even think to sanity check myself on this.
Now is better than never, so let's choose a reasonable limit. Here's a plot of the total number of non-black pixels at every iteration for 75 different runs:
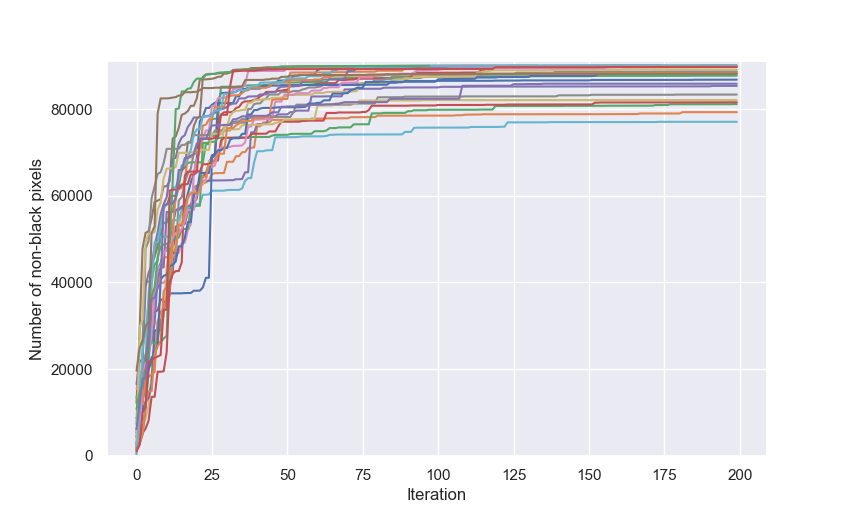
It looks like anywhere from 120 to 150 iterations is more sensible as stopping point.
have occurred.
It took an average of 191 iterations and 13m49s to generate an image on my laptop. My laptop is a second generation Lenovo ThinkPad X1 Yoga with 8 GB RAM and an Intel Core i7-7500U @ 2.70 GHz.
Here's a table with the main pieces of the loop and the time they took to run.
Would you believe pandas has a built-in method for spitting out LaTeX?
Just keep in mind that MathJax won't render tables, so you'll need to fake it with an array.
Zeros do not imply instant operations, just something much less than 1 ms.
\begin{array}{lr}
\hline
{} Operation & Time\;(sec) \\
\hline
np.atleast\_3d & 0.000 \\
element-wise\;addition & 0.000 \\
array.reshape & 0.000 \\
array.reshape & 0.000 \\
element-wise\;multiplication & 0.001 \\
element-wise\;multiplication & 0.001 \\
KMeans.predict & 0.018 \\
ConnectedComponents & 0.161 \\
KMeans.fit & 4.139 \\
\hline
Total & 4.326 \\
\end{array}
It might be a little silly to bother comparing individual operations with entire algorithms. The point is that after we cluster, we don't really add
When I implemented the depth-first search for connected component labelling, I made the mistake of using an list to keep track of the labelled pixels. Since I was only checking membership and not iterating over this information, a set was actually the better type. Checking membership in a set takes constant time. Checking membership in a list takes linear time. Labelling connected components was taking an average of 40.56 seconds with a list. It takes 0.16 seconds with a set. At 191 iterations per image generated, I was adding over 2 hours with this mistake.
very much complexity. If we want to generate images faster, we're going to get the most benefit targetting the k-means algorithm.
If I were to revisit this project, there are a few interesting methods available for speeding up k-means:
- Algorithms
- Architectures
- Languages
-
It could pay to rewrite the script up in a more performant language.
As far as I've read, numpy is pretty well-optimized for many of the operations. Yet in one benchmark I found, vanilla Python doesn't look so hot (72x slower than the fastest language, and 19x slower than PyPy).
I've been itching to learn Julia, but I'm not sure this will be first on the list of projects.
And how does varying k change things?
\begin{array}{lrrrrr}
{}K & Pixels\ Added\;per\;Iteration & Total\;Iteration\;(sec) & KMeans.fit\;(sec) & KMeans.predict\;(sec) & ConnectedComponents\;(sec)\\
\hline
5 & 745 & 2.523 & 2.303 & 0.017 & 0.194 \\
6 & 455 & 3.344 & 3.145 & 0.018 & 0.174 \\
7 & 434 & 4.281 & 4.099 & 0.018 & 0.156 \\
8 & 320 & 5.375 & 5.205 & 0.018 & 0.144 \\
9 & 299 & 6.247 & 6.087 & 0.019 & 0.134 \\
\end{array}
In KMeans, we need to calculate k distances each time we assign a given pixel to its proper cluster, so it is no surprise that time grows
In fact, we calculate k Euclidean distances in d-dimensions for each of the n data, and generally we iterate at least i times, which is why k-means is generally said to be O(nkdi). In our case, we've got d = 3 and n = 90,000, and sklearn places a default maximum i = 300. Nothing to sneeze at for my little laptop.
with k. A smaller k value means larger clusters
The simplest (and weakest) way I can think about this: we need at least 1 pixel per cluster, so the theoretical maximum cluster of N pixels can't be any bigger than N-k. Of course, that would be an extremely homogeneous image, and the increase we see in the average number of pixels per iteration
which is the same as the number of pixels in the largest connected component of our chosen cluster
clearly isn't just linear in k like this imagined upper bound is.
It would be interesting to explore how different data distributions affect cluster size and other properties of k-means.
and vice versa. The connected components of a larger cluster are likely to be large themselves. Based on this, it makes sense that we see more pixels per iteration and longer connected components runtimes with smaller k.
There is a lot to revisit here if I so choose. I don't know if I'd consider myself a collage graduate, but I am certainly collage educated.
Here are all the images I have.
Here is the source for those images, and here
is where I found out about that source.
Funnily enough, I reviewed some of the old files I have from March 2019, and I'm not 100% sure I used Trevor's Python script. I might have failed to get it working (or something like that). I have his script, which uses the urllib2 library, in one folder from March. I have a different script, which uses the requests library, in another folder.
I raise this mainly to highlight the fact that it's important to document what you do! I think I need to start maintaining a sort of "lab notebook" for my projects.
Here is the code that generates the images (I tried to name everything such that if you've read up to this point you will know exactly what you're looking at, but I'm happy to go back and comment everything in detail if someone tells me it is unclear).
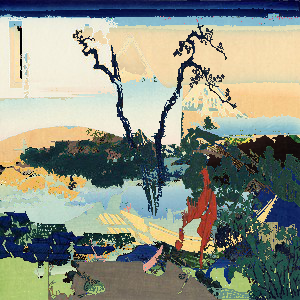
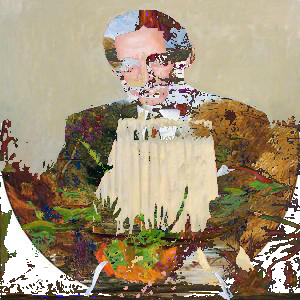
P.S. This wound up being my favorite image even though it was generated very early in the project before everything was baked.
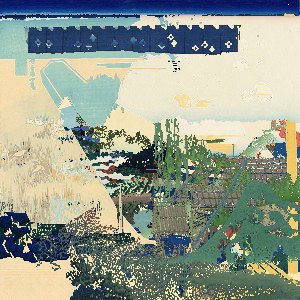
I also wound up running the script over all Thirty-six Views of Mount Fuji, because it seemed like a lot of fun and the colors pop a lot more in those beauties.